World’s Busiest Airports in December 2025: Delhi Ranks Among Top 10
Global air travel ended 2025 on a strong note, with major aviation hubs reporting robust seat capacity in December, according to data released by aviation analytics firm OAG. The latest rankings highlight the continued dominance of large hub airports during the year-end holiday season, driven by sustained demand across domestic and international routes.
India featured prominently in the rankings, underlining its growing role in global aviation. OAG compiles separate lists for “global airports” and “international airports”. The global ranking is based on total scheduled airline seat capacity, including both domestic and international services, while the international list considers only seats allocated to overseas routes. The distinction is significant, as airports with extensive domestic networks may appear busier by flight numbers but not necessarily by passenger capacity.
Dubai tops list, Delhi records strong growth
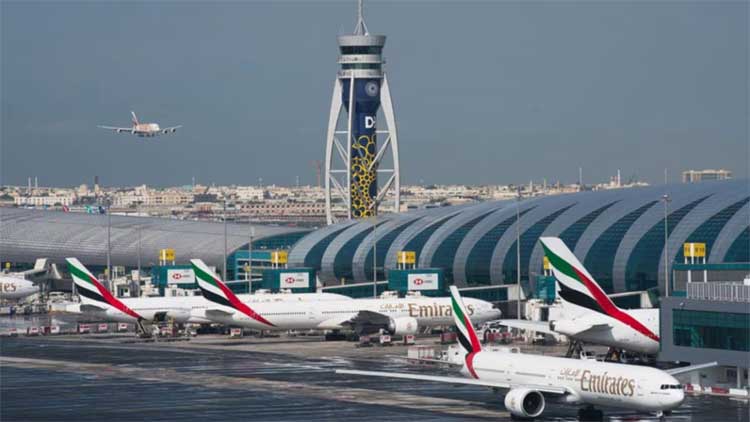
Dubai International Airport retained its position as the world’s busiest airport by seat capacity in December 2025, with 5.50 million scheduled seats — a 4% increase from December 2024. Dubai’s ranking is supported by its role as a major long-haul hub, strong intercontinental connectivity and sustained winter tourism demand.
Delhi’s Indira Gandhi International Airport ranked seventh globally, recording 4.31 million seats, a 9% year-on-year increase. The growth reflects rising domestic travel, expanding international links and Delhi’s importance as a key aviation hub in South Asia.
World’s top 10 busiest global airports by seat capacity (December 2025)
-
Dubai International Airport (DXB) – 5,498,334 seats
-
Atlanta Hartsfield-Jackson International Airport (ATL) – 5,211,533
-
Tokyo Haneda Airport (HND) – 4,675,127
-
Guangzhou Baiyun International Airport (CAN) – 4,430,746
-
London Heathrow Airport (LHR) – 4,345,154
-
Shanghai Pudong International Airport (PVG) – 4,317,590
-
Delhi Indira Gandhi International Airport (DEL) – 4,306,307
-
Dallas/Fort Worth International Airport (DFW) – 4,290,733
-
Istanbul Airport (IST) – 4,224,881
-
Chicago O’Hare International Airport (ORD) – 4,119,711
These airports typically benefit from strategic location, dominant home carriers, large-scale infrastructure and strong economic or tourism demand, enabling them to sustain high passenger volumes during peak travel periods.
Why seat capacity matters
OAG defines the “busiest” airports using scheduled seat capacity, offering a forward-looking measure of expected passenger traffic. This differs from rankings based solely on flight movements, which count take-offs and landings. Capacity-based rankings better reflect airports handling larger aircraft, longer routes and consistently high demand.
For travellers and industry watchers, the data highlights how emerging hubs such as Delhi are increasingly sharing space with long-established global gateways.
Comments are closed.